
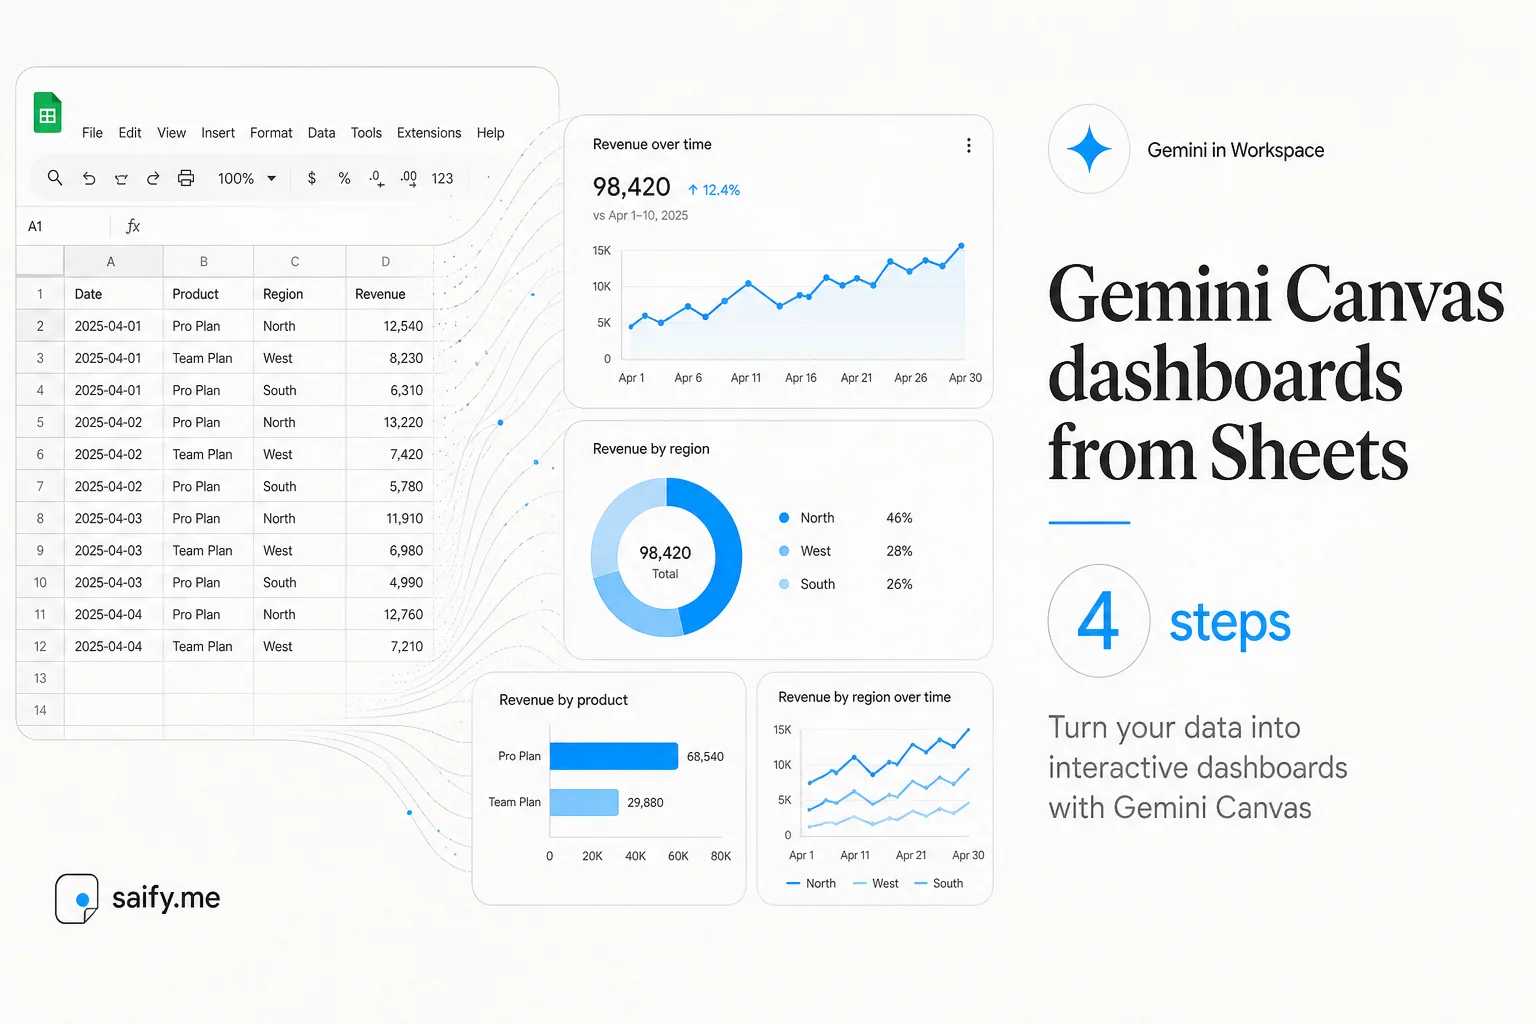
Most ops teams already live in Google Sheets. The gap is the stakeholder view: charts, filters, and a link that does not require explaining which tab hides the numbers.
Google's Gemini Canvas is the fastest path I have seen in 2026 to bridge that gap without standing up a full BI stack first.
When Canvas beats a blank Looker project
I use Canvas when:
- The source of truth is already a Sheet (CRM export, content calendar, project tracker)
- Stakeholders need a clickable dashboard this week, not a quarter-long BI rollout
- The view will iterate in conversation ("add a filter by owner", "split tab two by week")
I still use Looker Studio for client-facing production dashboards with SLAs. Canvas is prototype speed, not replacement governance.
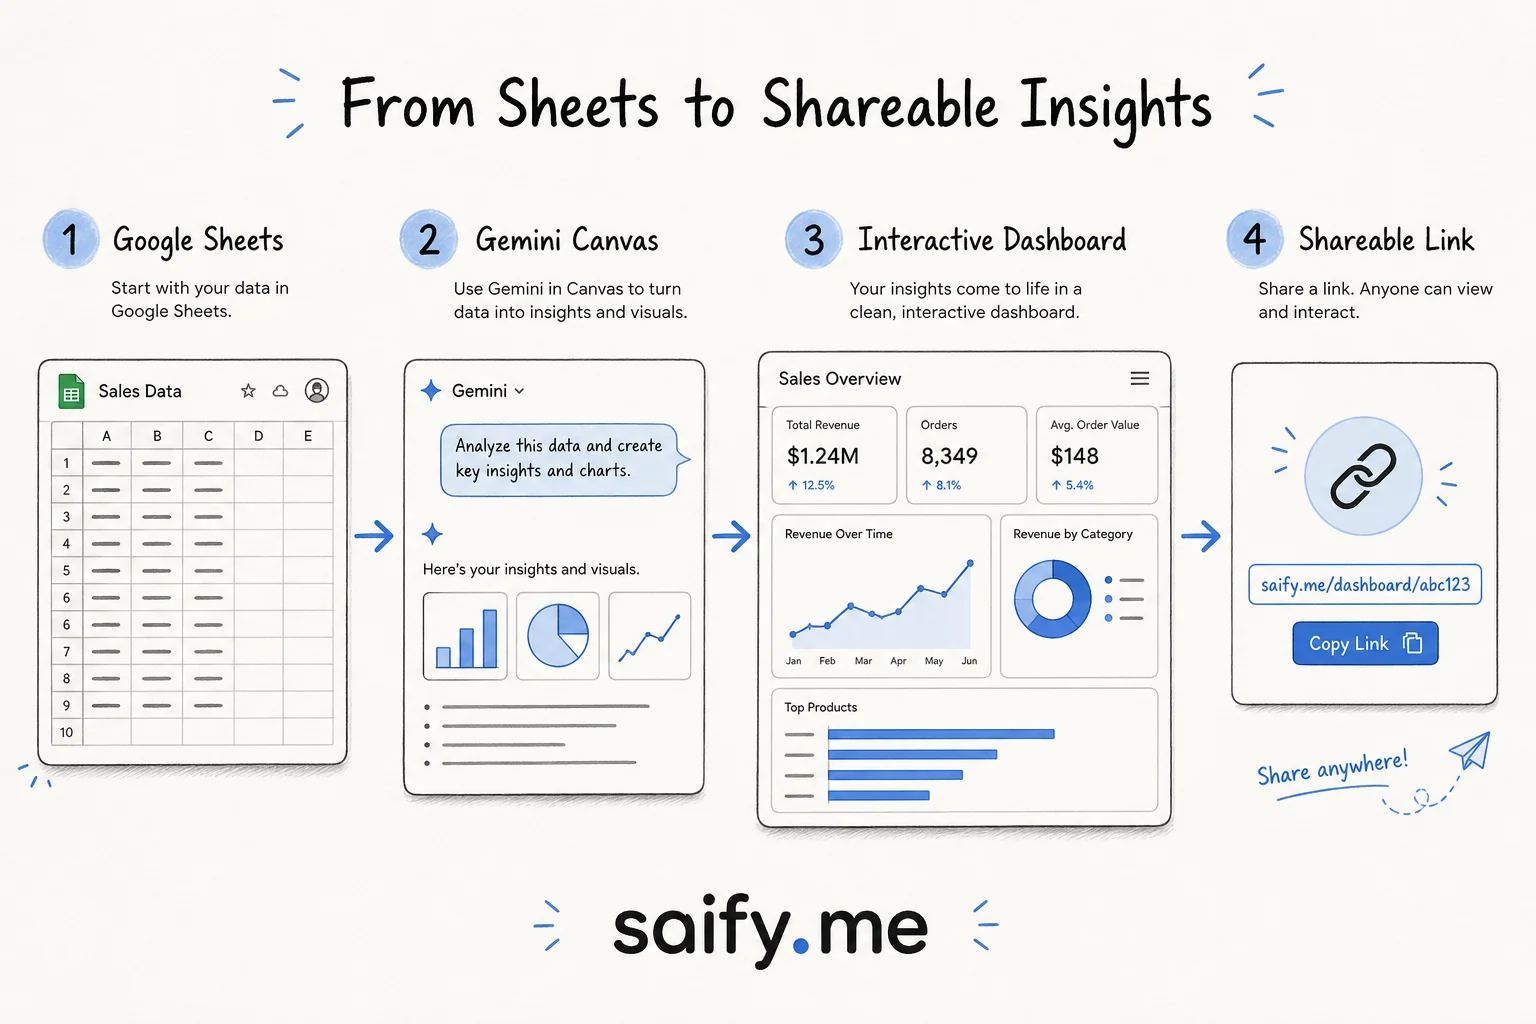
The four-step workflow
This matches The Rundown's Canvas guide and what I would run on a real tracker:
1. Open the Sheet and launch Canvas
Open your spreadsheet in Google Sheets. In a new tab, open Gemini, click +, and choose Canvas.
Pick a Sheet with:
- One header row per tab
- Consistent date columns
- No merged cells in the data region (Canvas parsers hate merged ranges)
2. Prompt with tab names, not vibes
Example prompt:
Make an interactive dashboard using data from tabs "Pipeline" and "Weekly KPIs".
Show: deals by stage, owner workload, and week-over-week trend for qualified leads.
Use filters for owner and date range.
Name tabs explicitly. If your calendar lives on tab two, say tab two.
3. Copy the Canvas link for stakeholders
When Gemini finishes, copy the Canvas link and open it in a browser. That URL is the shareable view outside the chat UI.
Share with the same Google account permissions you would use for the underlying Sheet. Canvas is not a bypass for access control.
4. Iterate in chat like a design partner
Need a stacked bar instead of pie charts? Ask in the same thread. Shared viewers pick up updates on refresh.
Pro tip from the digest: ask Canvas to generate slides from the same tabs, then export to Google Slides or PDF for exec readouts. One data source, two surfaces.
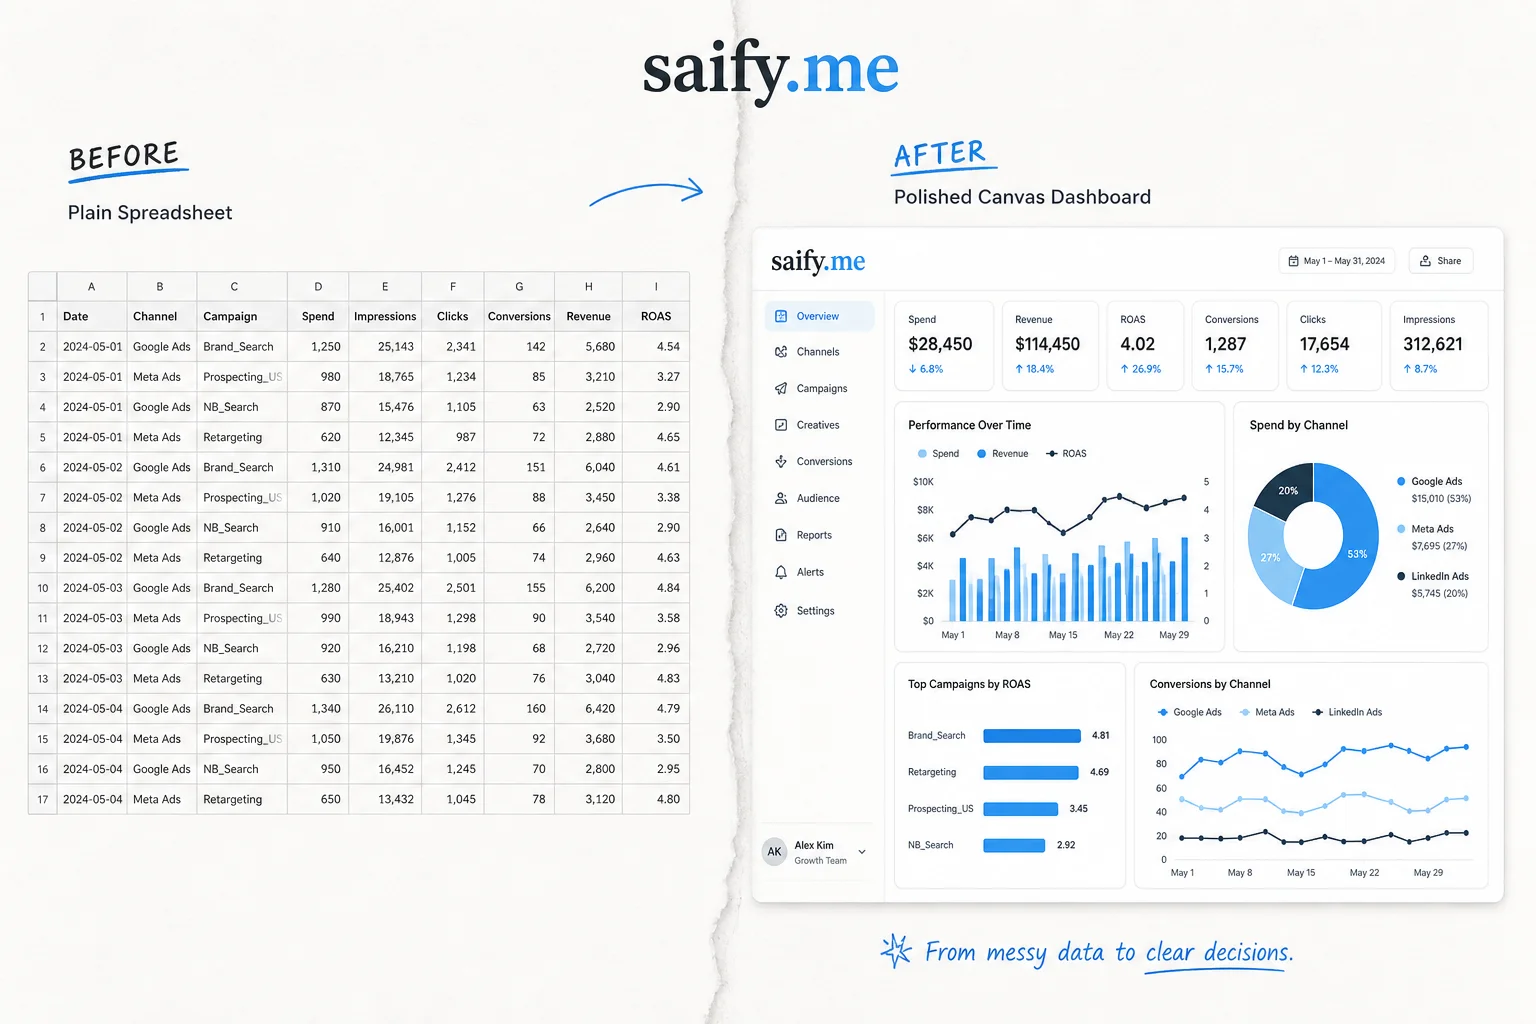
What I would wire for client ops
| Use case | Sheet tabs | Canvas output |
|---|---|---|
| Voice agent QA | Call log + disposition codes | Daily answer rate, missed-call heatmap |
| Content calendar | Drafts + publish dates | Pipeline by pillar, overdue drafts |
| Lead routing | Inbound + owner assignment | SLA breaches, source mix |
Keep PII out of demo Sheets. Redact phone numbers before you prompt.
Limits to plan for
- No substitute for ETL: dirty Sheets still produce dirty dashboards
- Version drift: if someone renames tabs, re-prompt with new names
- Export path: when a prototype sticks, rebuild metrics in Looker or your warehouse with tests
Canvas shines in the first 80% of stakeholder alignment. I have seen teams burn two weeks in BI tickets for what Canvas proves in an afternoon.
If you want help connecting Sheets, CRM exports, and AI-generated ops views into a site that actually converts, get in touch.